What I'm working with: I have a collection of prices that has very few to no repeating values (depending on the look back period) ie each price value is unique, some prices are clustered and some can be spread apart by great distances.
Because there is only one count for each price, each price therefore has an equal probability weight. This type of data produces a flat (pdf). I'm looking for a curvy linear (pdf), so I can find levels of interest.
Question: How do I construct a curvy-linear (p.d.f.) from data that have the same frequency/count and probability distribution of (1)?
Potential Solutions:
1) Some of the values are clustered, and they look like they could be grouped to generate an aggregate-frequency/count.
I like this idea, but what technique do you use?
2) I could use volume or ticks to weight the notional price value.
For my work, I'm not interested in the influence that volume or tick weighted distributions would have.
Recommendations of papers or other resources is greatly appreciated.
@vanguard2k
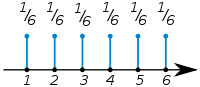
First, I assume that your price data are all from the same asset but spread over a certain time range. Correct, all prices are from one symbol the S&P500 futures, intraday price. As a first step you could make a histogram of your data. It's because of the 'lack' of shape of my histogram (it's flat, like a rug plot) that I'm looking for a technique to tease out a curvy-linear (pdf). Due to the infrequency of similar price values in my data set, the probability weight of any price is equal to all other price probability values, P($price)=1/sample qty.
My histogram looks similar to this wiki picture: http://upload.wikimedia.org/wikipedia/commons/thumb/4/4c/Fair_dice_probability_distribution.svg/200px-Fair_dice_probability_distribution.svg.png
You could look into the topic of density estimation here.
I've spent the day reviewing your links, and the method of kernel density estimation (kde) looks promising. But I don't completely comprehend how to construct a (kde).
I've started a list of how to plot a (kde). What steps have to be taken to implement a kernel density estimations with real world price examples?
Procedure?:
1 Determine what type of partitioning/clustering method to apply to a financial time series (5 categories/methods: partitioning, hierarchical, density, grid-based, and model-based).
2 Apply the clustering technique to partition observations into groups.
3 Calculate a Practical Estimate of a kernel bandwidth, h = (1.06*StDev*qtySampled)¯¹/5, or MISE.
4 Determine what kernel function to use (Epanechnikov, Quartic, Triangular, Gaussian, Cosine, etc)
5 Calculate a kernel density estimation for each price.
6 Sum the kernels to make the kernel density estimate.
Question: Does the (kde) assign a probability value to the prices that were not in the price data set? The first (kde) example image on Wikipedia suggest that it does. http://en.wikipedia.org/wiki/File:Comparison_of_1D_histogram_and_KDE.png
If you dont have time series data but only price data and you want to cluster it (you are speaking of "price level clusters") you should look into the topic of unsupervised learning. I don't understand the difference between 'time series data' and 'price data'?

No comments:
Post a Comment